
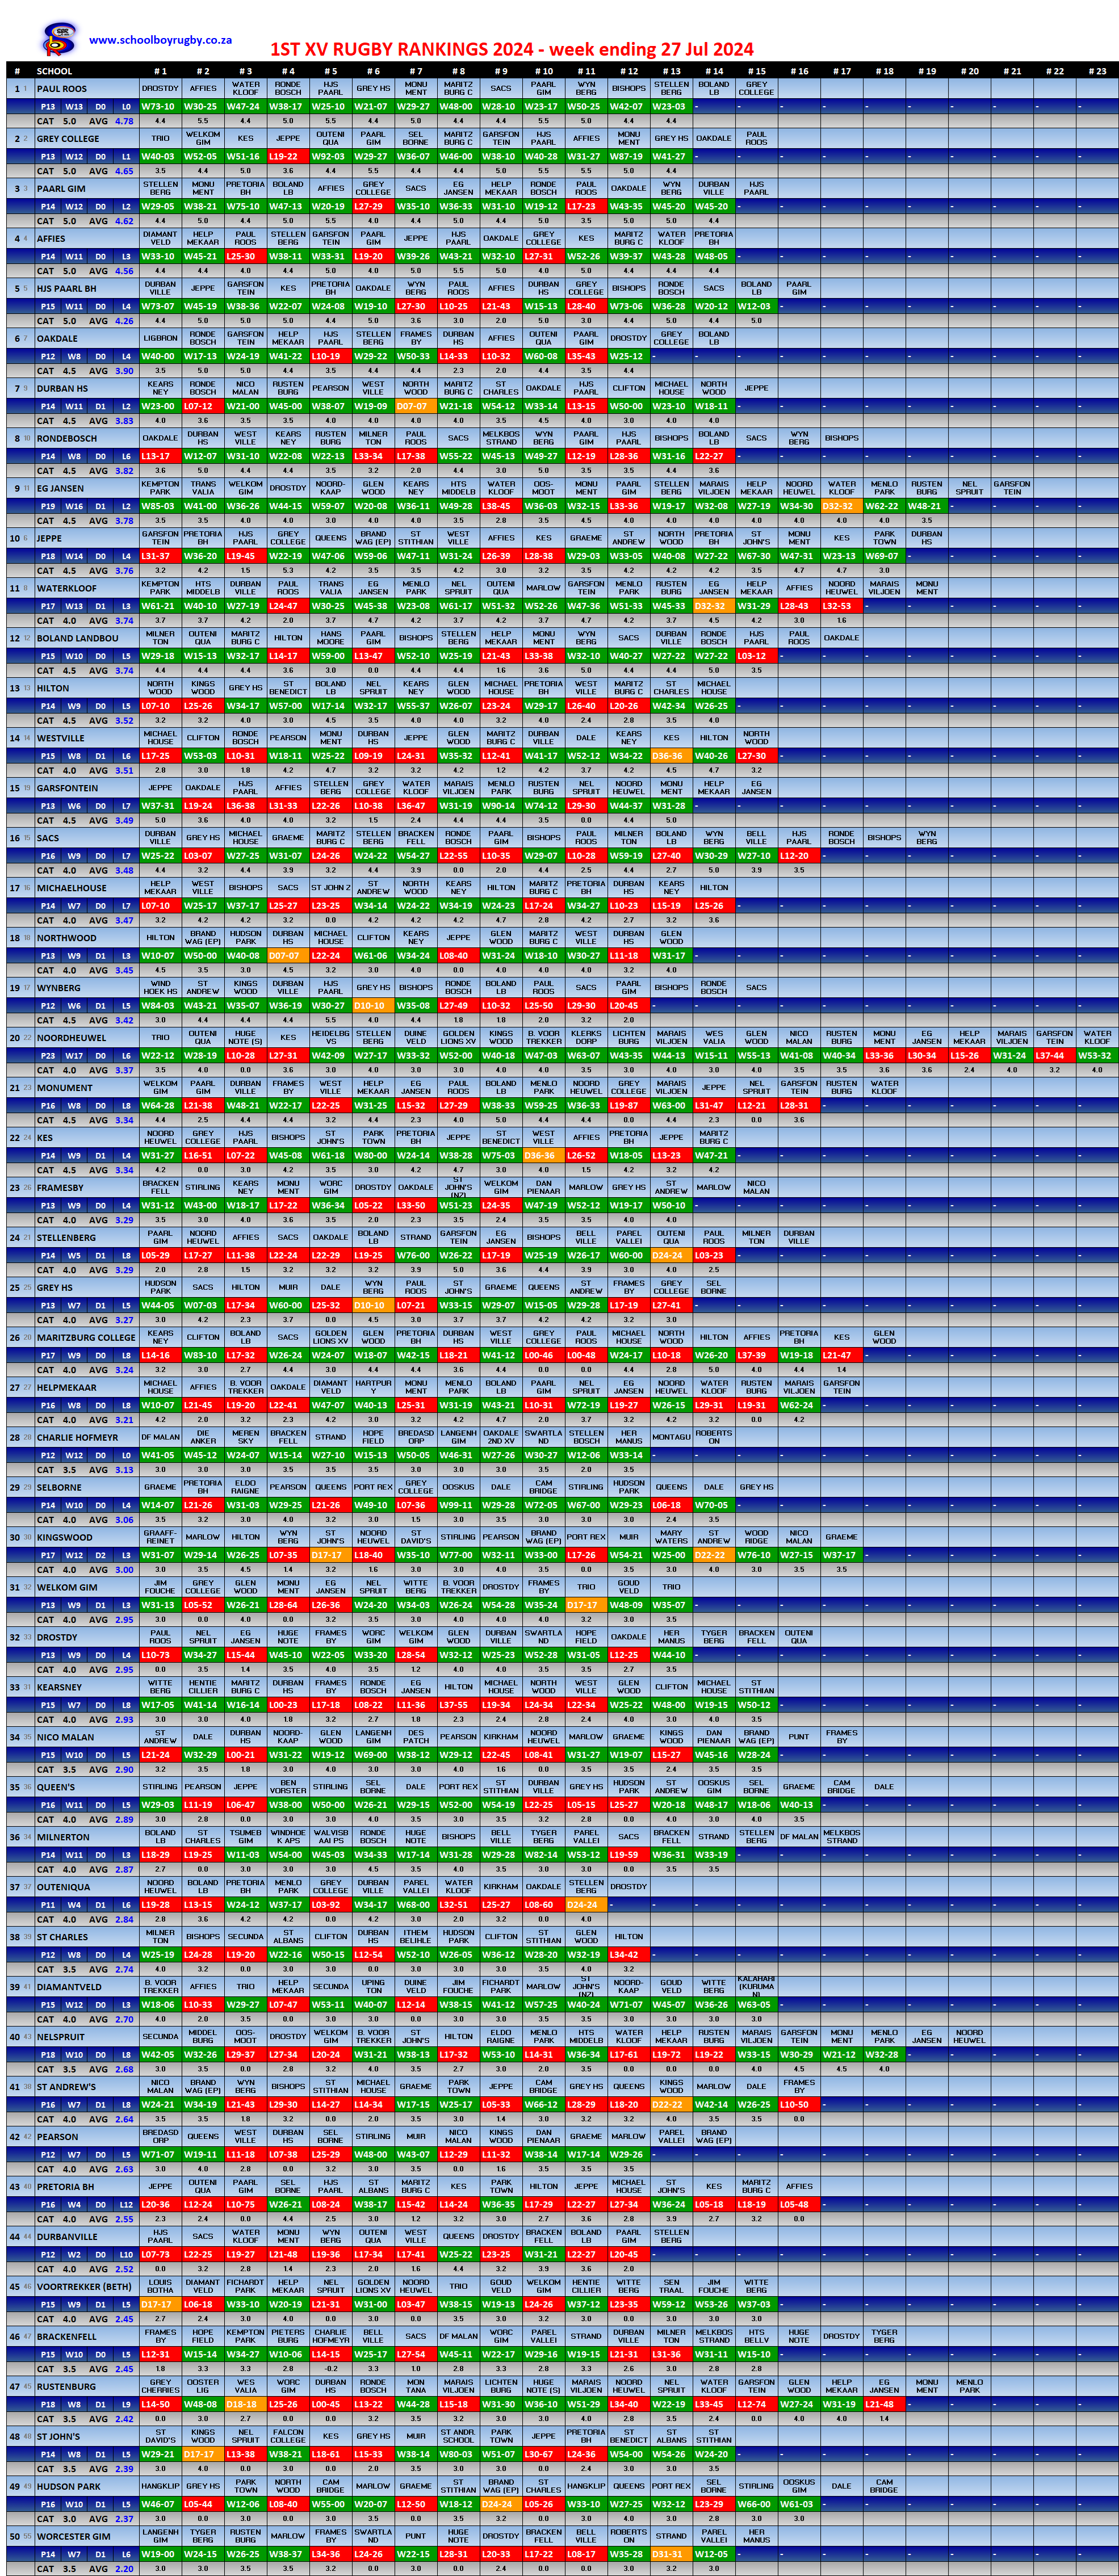
Rankings model powered by a version of The BHP formula
| # | SCHOOL | REG | AVG | P | W | D | L | PF | PA | PD | CP | LP | WP | TTL | AVG | LAST 8 GAMES | ||||||||
| 1 | 1 | Paul Roos | WP | 4.78 | 13 | 13 | 0 | 0 | 477 | 182 | 295 | 56.5 | 0.0 | 5.6 | 62.1 | 4.78 | W | W | W | W | W | W | W | W |
| 2 | 2 | Grey College | FS | 4.65 | 13 | 12 | 0 | 1 | 602 | 194 | 408 | 52.0 | 3.6 | 4.8 | 60.4 | 4.65 | W | W | W | W | W | W | W | W |
| 3 | 3 | Paarl Gim | WP | 4.62 | 14 | 12 | 0 | 2 | 507 | 260 | 247 | 52.0 | 7.5 | 5.2 | 64.7 | 4.62 | W | W | W | W | L | W | W | W |
| 4 | 4 | Affies | BUL | 4.56 | 14 | 11 | 0 | 3 | 516 | 307 | 209 | 47.0 | 12.0 | 4.8 | 63.8 | 4.56 | W | W | W | L | W | W | W | W |
| 5 | 5 | HJS Paarl BH | WP | 4.26 | 15 | 11 | 0 | 4 | 463 | 287 | 176 | 47.5 | 11.6 | 4.8 | 63.9 | 4.26 | L | L | W | L | W | W | W | W |
| 6 | 7 | Oakdale | SWD | 3.90 | 12 | 8 | 0 | 4 | 355 | 256 | 99 | 32.5 | 11.3 | 3.0 | 46.8 | 3.90 | L | W | W | L | L | W | L | W |
| 7 | 9 | Durban HS | KZN | 3.83 | 14 | 11 | 1 | 2 | 372 | 115 | 257 | 42.0 | 11.6 | 0.0 | 53.6 | 3.83 | D | W | W | W | L | W | W | W |
| 8 | 10 | Rondebosch | WP | 3.82 | 14 | 8 | 0 | 6 | 392 | 287 | 105 | 31.5 | 19.4 | 2.6 | 53.5 | 3.82 | L | W | W | W | L | L | W | L |
| 9 | 11 | EG Jansen | VAL | 3.78 | 19 | 16 | 1 | 2 | 763 | 346 | 417 | 61.0 | 10.8 | 0.0 | 71.8 | 3.78 | L | W | W | W | W | D | W | W |
| 10 | 6 | Jeppe | LIO | 3.76 | 18 | 14 | 0 | 4 | 681 | 364 | 317 | 55.0 | 10.8 | 1.9 | 67.7 | 3.76 | W | W | W | W | W | W | W | W |
| 11 | 8 | Waterkloof | BUL | 3.74 | 17 | 13 | 1 | 3 | 680 | 502 | 178 | 50.0 | 11.1 | 2.5 | 63.6 | 3.74 | W | W | W | W | D | W | L | L |
| 12 | 12 | Boland Landbou | WP | 3.74 | 15 | 10 | 0 | 5 | 422 | 315 | 107 | 40.0 | 12.3 | 3.8 | 56.1 | 3.74 | W | L | L | W | W | W | W | L |
| 13 | 13 | Hilton | KZN | 3.52 | 14 | 9 | 0 | 5 | 419 | 294 | 125 | 34.5 | 14.8 | 0.0 | 49.3 | 3.52 | W | W | L | W | L | L | W | W |
| 14 | 14 | Westville | KZN | 3.51 | 15 | 8 | 1 | 6 | 433 | 358 | 75 | 31.5 | 19.8 | 1.4 | 52.7 | 3.51 | W | L | W | W | W | D | W | L |
| 15 | 19 | Garsfontein | BUL | 3.49 | 13 | 6 | 0 | 7 | 490 | 377 | 113 | 24.5 | 18.7 | 2.2 | 45.4 | 3.49 | L | L | W | W | W | L | W | W |
| 16 | 15 | SACS | WP | 3.48 | 16 | 9 | 0 | 7 | 414 | 379 | 35 | 35.0 | 17.1 | 3.6 | 55.7 | 3.48 | L | W | L | W | L | W | W | L |
| 17 | 16 | Michaelhouse | KZN | 3.47 | 14 | 7 | 0 | 7 | 334 | 293 | 41 | 28.5 | 18.7 | 1.4 | 48.6 | 3.47 | W | W | W | L | W | L | L | L |
| 18 | 18 | Northwood | KZN | 3.45 | 13 | 9 | 1 | 3 | 353 | 212 | 141 | 34.0 | 10.8 | 0.0 | 44.8 | 3.45 | W | W | L | W | W | W | L | W |
| 19 | 17 | Wynberg | WP | 3.42 | 12 | 6 | 1 | 5 | 384 | 301 | 83 | 24.0 | 14.8 | 2.2 | 41.0 | 3.42 | W | D | W | L | L | L | L | L |
| 20 | 22 | Noordheuwel | LIO | 3.37 | 23 | 17 | 0 | 6 | 828 | 486 | 342 | 61.0 | 16.4 | 0.0 | 77.4 | 3.37 | W | W | L | L | L | W | L | W |
| 21 | 23 | Monument | LIO | 3.34 | 16 | 8 | 0 | 8 | 536 | 492 | 44 | 32.5 | 17.8 | 3.2 | 53.5 | 3.34 | W | W | W | L | W | L | L | L |
| 22 | 24 | KES | LIO | 3.34 | 14 | 9 | 1 | 4 | 517 | 308 | 209 | 34.0 | 11.6 | 1.2 | 46.8 | 3.34 | W | W | W | D | L | W | L | W |
| 23 | 26 | Framesby | EP | 3.29 | 13 | 9 | 0 | 4 | 426 | 273 | 153 | 32.5 | 10.3 | 0.0 | 42.8 | 3.29 | L | L | W | L | W | W | W | W |
| 24 | 21 | Stellenberg | WP | 3.29 | 14 | 5 | 1 | 8 | 353 | 296 | 57 | 18.5 | 25.9 | 1.6 | 46.0 | 3.29 | W | W | L | W | W | W | D | L |
| 25 | 25 | Grey HS | EP | 3.27 | 13 | 7 | 1 | 5 | 320 | 220 | 100 | 25.5 | 15.9 | 1.1 | 42.5 | 3.27 | D | L | W | W | W | W | L | L |
| 26 | 20 | Maritzburg College | KZN | 3.24 | 17 | 9 | 0 | 8 | 420 | 397 | 23 | 34.5 | 17.7 | 2.8 | 55.0 | 3.24 | L | L | W | L | W | L | W | L |
| 27 | 27 | Helpmekaar | LIO | 3.21 | 16 | 8 | 0 | 8 | 495 | 382 | 113 | 31.0 | 19.0 | 1.4 | 51.4 | 3.21 | W | L | W | L | W | L | L | W |
| 28 | 28 | Charlie Hofmeyr | BOL | 3.13 | 12 | 12 | 0 | 0 | 365 | 170 | 195 | 37.5 | 0.0 | 0.0 | 37.5 | 3.13 | W | W | W | W | W | W | W | W |
| 29 | 29 | Selborne | BOR | 3.06 | 14 | 10 | 0 | 4 | 544 | 223 | 321 | 32.5 | 10.3 | 0.0 | 42.8 | 3.06 | L | W | W | W | W | W | L | W |
| 30 | 30 | Kingswood | EP | 3.00 | 17 | 12 | 2 | 3 | 563 | 270 | 293 | 44.2 | 6.9 | 0.0 | 51.1 | 3.00 | W | L | W | W | D | W | W | W |
| 31 | 32 | Welkom Gim | GRF | 2.95 | 13 | 9 | 1 | 3 | 389 | 318 | 71 | 35.2 | 3.2 | 0.0 | 38.4 | 2.95 | W | W | W | W | W | D | W | W |
| 32 | 33 | Drostdy | BOL | 2.95 | 13 | 9 | 0 | 4 | 383 | 336 | 47 | 33.0 | 5.3 | 0.0 | 38.3 | 2.95 | W | L | W | W | W | W | L | W |
| 33 | 31 | Kearsney | KZN | 2.93 | 15 | 7 | 0 | 8 | 354 | 338 | 16 | 24.5 | 19.4 | 0.0 | 43.9 | 2.93 | L | L | L | L | W | W | W | W |
| 34 | 35 | Nico Malan | EP | 2.90 | 15 | 10 | 0 | 5 | 407 | 319 | 88 | 34.5 | 9.0 | 0.0 | 43.5 | 2.90 | W | L | L | W | W | L | W | W |
| 35 | 36 | Queen’s | BOR | 2.89 | 16 | 11 | 0 | 5 | 473 | 245 | 228 | 37.5 | 8.8 | 0.0 | 46.3 | 2.89 | W | L | L | L | W | W | W | W |
| 36 | 34 | Milnerton | WP | 2.87 | 14 | 11 | 0 | 3 | 481 | 298 | 183 | 37.5 | 2.7 | 0.0 | 40.2 | 2.87 | W | W | W | W | W | L | W | W |
| 37 | 37 | Outeniqua | SWD | 2.84 | 11 | 4 | 1 | 6 | 287 | 343 | -56 | 15.0 | 15.6 | 0.6 | 31.2 | 2.84 | W | L | W | W | L | L | L | D |
| 38 | 39 | St Charles | KZN | 2.74 | 12 | 8 | 0 | 4 | 360 | 260 | 100 | 26.5 | 6.4 | 0.0 | 32.9 | 2.74 | W | L | W | W | W | W | W | L |
| 39 | 41 | Diamantveld | GRQ | 2.70 | 15 | 12 | 0 | 3 | 560 | 266 | 294 | 38.5 | 2.0 | 0.0 | 40.5 | 2.70 | W | W | W | W | W | W | W | W |
| 40 | 43 | Nelspruit | PUM | 2.68 | 18 | 10 | 0 | 8 | 510 | 506 | 4 | 37.5 | 10.7 | 0.0 | 48.2 | 2.68 | W | L | L | L | W | W | W | W |
| 41 | 38 | St Andrew’s | EP | 2.64 | 16 | 7 | 1 | 8 | 395 | 411 | -16 | 23.5 | 18.7 | 0.0 | 42.2 | 2.64 | L | W | L | L | D | W | W | L |
| 42 | 42 | Pearson | EP | 2.63 | 12 | 7 | 0 | 5 | 331 | 225 | 106 | 24.0 | 7.6 | 0.0 | 31.6 | 2.63 | L | W | W | L | L | W | W | W |
| 43 | 40 | Pretoria BH | BUL | 2.55 | 16 | 4 | 0 | 12 | 309 | 497 | -188 | 13.5 | 26.5 | 0.8 | 40.8 | 2.55 | W | L | L | L | W | L | L | L |
| 44 | 44 | Durbanville | WPB | 2.52 | 12 | 2 | 0 | 10 | 243 | 424 | -181 | 7.5 | 22.0 | 0.8 | 30.3 | 2.52 | L | L | L | W | L | W | L | L |
| 45 | 46 | Voortrekker (Beth) | GRF | 2.45 | 15 | 9 | 1 | 5 | 421 | 284 | 137 | 31.2 | 5.6 | 0.0 | 36.8 | 2.45 | W | W | L | W | L | W | W | W |
| 46 | 47 | Brackenfell | WPB | 2.45 | 15 | 10 | 0 | 5 | 350 | 311 | 39 | 27.5 | 9.2 | 0.0 | 36.7 | 2.45 | W | W | W | W | L | L | W | W |
| 47 | 45 | Rustenburg | LEO | 2.42 | 18 | 8 | 1 | 9 | 475 | 553 | -78 | 30.7 | 12.9 | 0.0 | 43.6 | 2.42 | W | L | W | L | L | W | W | L |
| 48 | 48 | St John’s | LIO | 2.39 | 14 | 8 | 1 | 5 | 485 | 364 | 121 | 25.0 | 8.4 | 0.0 | 33.4 | 2.39 | W | W | W | L | L | W | W | W |
| 49 | 49 | Hudson Park | BOR | 2.37 | 16 | 10 | 1 | 5 | 447 | 295 | 152 | 35.2 | 2.8 | 0.0 | 38.0 | 2.37 | D | L | W | W | W | L | W | W |
| 50 | 55 | Worcester Gim | BOL | 2.20 | 14 | 7 | 1 | 6 | 338 | 321 | 17 | 25.2 | 5.6 | 0.0 | 30.8 | 2.20 | W | L | L | L | L | W | D | W |
@caleb cancelo (Comment #2)
The points differences in losses matter as do the quality of opposition.
Every year there a numerous vicious circles like Rondebosch who beat DHS who beat Oakdale who beat Rondebosch.
And there is never a shortage of supporters looking for a simple linear equation when a complex 3D line equation is what’s required.
I welcome any suggestions to improve the formula.
One of the things I was thinking is to offer a game points floor of 1.3 to any school that takes on a Big 5 powerhouse and loses heavily. That could translate to an average of ± 0.10 (per big game) for the season. Its enough extra points to move up several places.
@caleb cancelo (Comment #2)
The two are separated by 0,07 out of 5,00. Both are great teams and worthy of their positions.
The “team below” Oakdale lost at home against Rondebosch, which Oakdale beat away. Both lost to HJS ‘away’.
Oakdale’s other losses was against minions like Affies and Paarl Gim.
The “team below” has a chance this weekend against Jeppe, who beat the team that
Oakdale is playing. Both are playing at home.
The results will impact their positions, BUT only based on the best formula we currently have until someone propose a better formula.
I’m still Abit confused on how are oakdale so high with 4 losses including a 33-14 loss to the team just 1 below them?
I do actually like these rankings and must say yesterday I saw the stark difference between where Jeppe Rugby was in 2009 and where it is today…… Parktown will be back but I must say yesterday victory was sweet and worth the ranking points lost ….. We look forward to the game in Durban this coming Saturday really an opportunity for this to be crowned the best Jeppe team of all time …. My word this has been an insanely long season …. then there are still 3 kids going to the SA schools series and again congratulations to Rasima our Head Boy on his appointment as SA A side captain 👏