
This is a first attempt to rank the national schoolboy rugby fixture lists on a variety of factors that contribute towards difficulty.
As always, any advice or suggestions would be most welcomed.
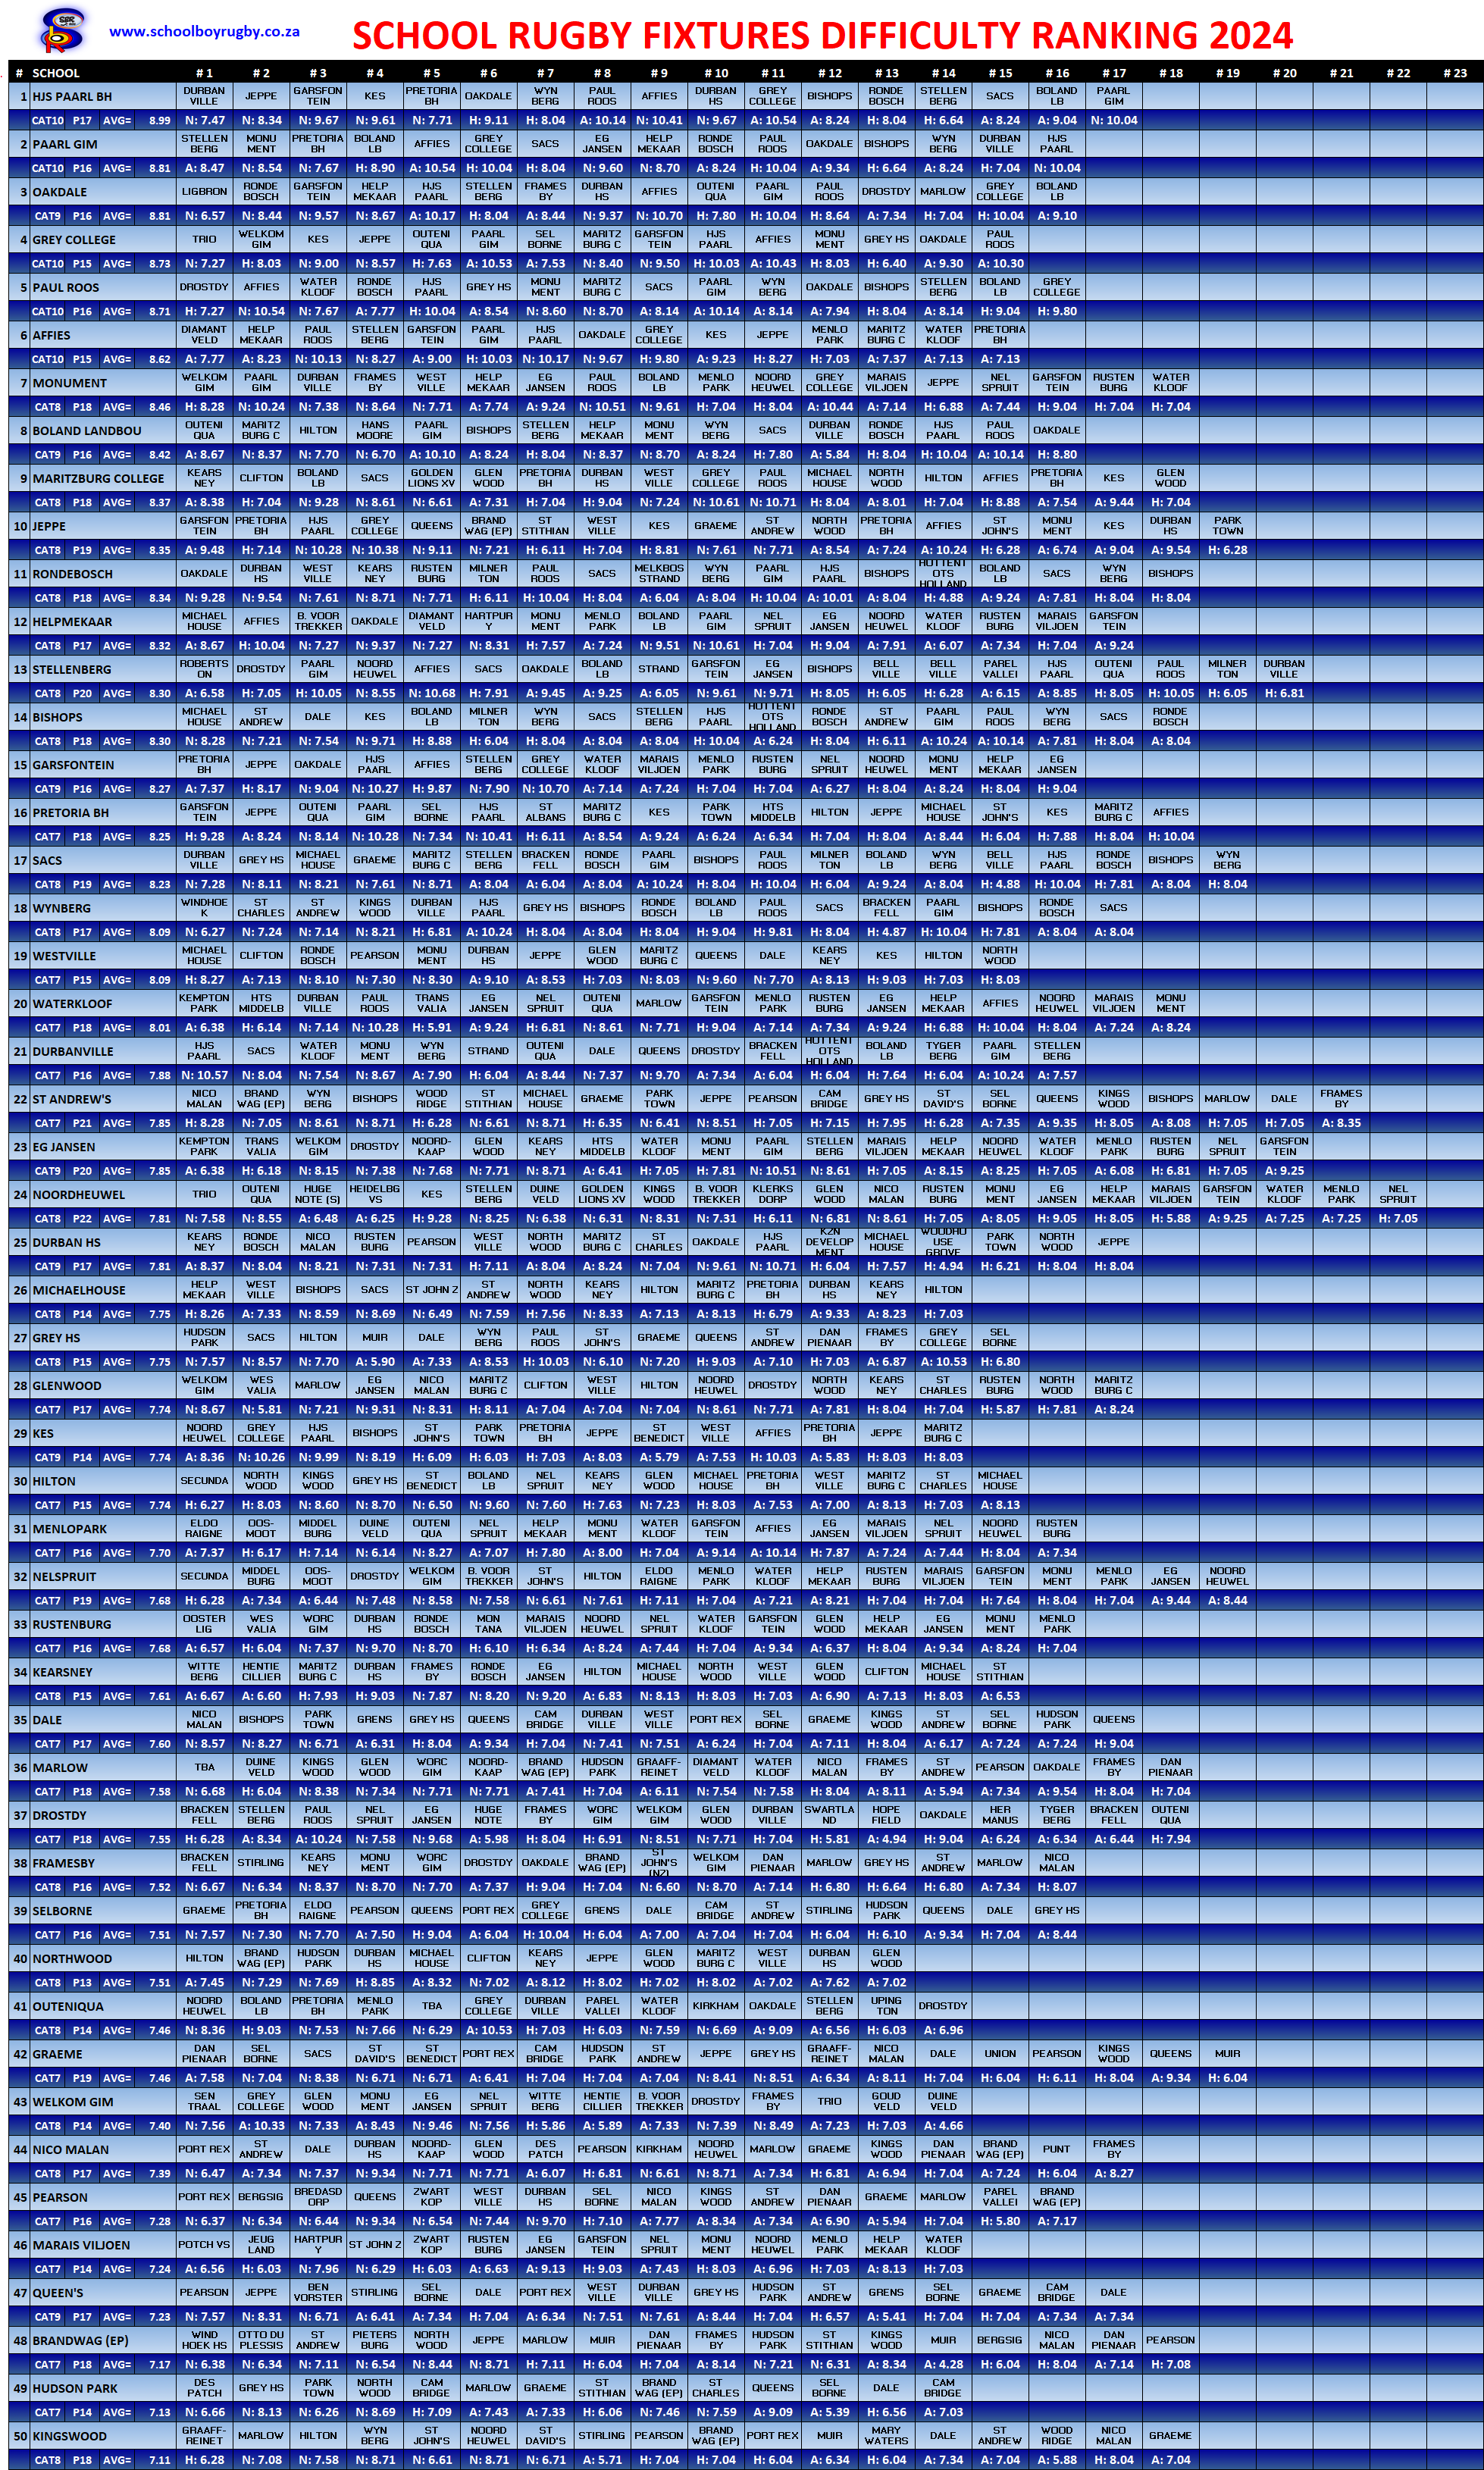
The factors considered are:
Strength of the opposition.
The stronger the opposition, the tougher the fixture list.
For the preseason presentation below, the category points attributed to each school is based on their perceived strength heading into the season.
Category points on its own contributes to over 90% of the overall ranking points per school.
Number of matches to be played.
This works off the basis that the more matches a school plays, the tougher their season is.
15 matches is used as the mean.
Additional points are therefore awarded to any school with more than 15-matches. Conversely points are deducted from schools having fewer than 15 competitive full-length matches.
For these calculations, the in-season and end of season cup competition play-offs are ignored for now. In some cases these will add 4 to 5 extra matches.
Frequency/intensity.
This is to acknowledge that all other things equal between two schools, the one that completes its fixture list from start to finish in the shorter time period, obviously plays more frequently which translates to shorter recovery periods and a more intense season.
Distance traveled.
This is an attempt to pay homage to the impact distance travel has. Having to leave home quite early, travel a considerable distance and sometimes even stay overnight at host players’ homes or in their boarding establishment, as part of the experience, all contributes to making a fixture harder than the one against a local rival just a few km’s away.
The points awarded to the traveling school therefore also doubles as compensation for playing away from home.
There is still quite a bit of tweaking to do.
TOP 20
| RANK | SCHOOL | RATE | GAMES | OPP | MAT | FREQ | DIST | POINTS |
|---|---|---|---|---|---|---|---|---|
| 1 | HJS Paarl BH | 10 | 17 | 8.65 | 0.12 | -0.02 | 0.25 | 8.99 |
| 2 | Paarl Gim | 10 | 16 | 8.56 | 0.06 | -0.03 | 0.21 | 8.81 |
| 3 | Oakdale | 9 | 16 | 8.56 | 0.06 | -0.07 | 0.25 | 8.81 |
| 4 | Grey College | 10 | 15 | 8.60 | – | -0.12 | 0.25 | 8.73 |
| 5 | Paul Roos | 10 | 16 | 8.50 | 0.06 | -0.05 | 0.21 | 8.71 |
| 6 | Affies | 10 | 15 | 8.47 | – | -0.04 | 0.19 | 8.62 |
| 7 | Monument | 8 | 18 | 8.11 | 0.17 | -0.01 | 0.19 | 8.46 |
| 8 | Boland Landbou | 9 | 16 | 8.19 | 0.06 | -0.05 | 0.23 | 8.42 |
| 9 | Maritzburg College | 8 | 18 | 8.00 | 0.17 | -0.01 | 0.21 | 8.37 |
| 10 | Jeppe | 8 | 19 | 7.95 | 0.21 | 0.03 | 0.16 | 8.35 |
| 11 | Rondebosch | 8 | 18 | 8.06 | 0.17 | -0.02 | 0.13 | 8.34 |
| 12 | Helpmekaar | 8 | 17 | 8.06 | 0.12 | -0.02 | 0.16 | 8.32 |
| 13 | Stellenberg | 8 | 20 | 7.90 | 0.25 | -0.01 | 0.16 | 8.30 |
| 14 | Bishops | 8 | 18 | 8.06 | 0.17 | -0.01 | 0.08 | 8.30 |
| 15 | Garsfontein | 9 | 16 | 8.13 | 0.06 | -0.05 | 0.14 | 8.27 |
| 16 | Pretoria BH | 7 | 18 | 7.94 | 0.17 | 0.01 | 0.13 | 8.25 |
| 17 | SACS | 8 | 19 | 7.95 | 0.21 | – | 0.07 | 8.23 |
| 18 | Wynberg | 8 | 17 | 8.00 | 0.12 | -0.04 | 0.01 | 8.09 |
| 19 | Westville | 7 | 15 | 7.87 | – | 0.10 | 0.13 | 8.09 |
| 20 | Waterkloof | 7 | 18 | 7.72 | 0.17 | -0.01 | 0.14 | 8.01 |
Affies playing 12 out of the 15 schools, tougest roster by far for Pretoria schools.
This is obviously only for first teams and depth is ignored, as is the beneficial effect of traveling to the coast from high altitude and the detrimental effect of traveling to altitude. Who travels more than GCB ? Often without half their team playing SA Schools…….
@Kantman (Comment #1)
Stellenberg should be higher imo …
I would give this revised listing a a 95% rating. Those top 6 schools are all playing each other – will be a mini league on its own.